 |
 |
| 6-4. Shortening of lexical long vowels |
|
All five Japanese vowels have the phonological contrast of vowel length like /a/ (short) and /aH/ (long). Contrast between the minimal pairs like /kodoku/ ('solitude') vs. /koHdoku/ ('subscribe'), or, /obasaN/ ('aunt') vs. /obaHsaN/ ('grand ma') are all lexically specified. Sometimes, however, phonological long vowels could be realized as if they were short vowels. For example, /deHtaH/ (English loan of 'data') and /hoNtoH/ (Sino-Japanese meaning 'really') could be realized as /deHta/ and /hoNto/ respectively.
Shortening of lexical long vowels is well known, but the factors governing its occurrence have not been fully understood. But there are some beliefs widely shared by Japanese linguists: 1) Loan words from European languages (English especially) are shortened more frequently than Sino-Japanese words, 2) High frequency words tend to be shortened, 3) Shortening occurs mostly in word-final position, 4) Shortening tends to occur when a long vowel is followed by another long vowel, 5) Shortening is a characteristic of informal speaking-style. Adequacy of these beliefs is examined using a subset of CSJ (manually POS analyzed 884k SUW sub-corpus).
| WORD CLASS |
NOT SHORTENED |
SHORTENED |
%SHORTENED |
| English loan |
5934 |
543 |
8.38% |
| Sino-Japanese |
47665 |
1004 |
2.06% |
|
As can be seen from the above table, the effect of word-class is statistically significant (P<.0001). But, different conclusion could be obtained when we look at the words with high shortening rate. The following figure shows the shortening rate [%] of 30 words that showed the highest shortening rates. Bars in red and gray correspond respectively to English loan and Sino-Japanese. As can be seen from the figure, word that showed the highest shortening rate (/hoNtoH/) was a Sino-Japanese, and, 15 out of the total of 30 words were Sino-Japanese.
The next figure is a scatter plot of the word-frequencies in CSJ and the shortening rates. There is no statistically significant correlation (Pearson correlation coefficient was 0.133). Removing words with high shortening rate (shown with purple letters), the coefficient becomes -0.018, but this is not significant either.
The following table examines the effect of position in a SUW. Shortening rate varies significantly depending on the position in a SUW. The belief that word-final position is the most enhancing position is supported by this result, but it is the shortening-preventing effect of the word-initial position that is the most remarkable.
| POSITION |
NOT SHORTENED |
SHORTENED |
%SHORTENED |
| INITIAL |
22429 |
21 |
0.09% |
| INTERMEDIATE |
2118 |
83 |
3.77% |
| FINAL |
29187 |
1444 |
4.71% |
|
The following table examines the effect of so-called special morae on shortening. When the long vowel in question is preceded by a special mora, shortening rate increased significantly, but the effect differs considerable depending on the preceding mora. It was moraic nasal that showed the strongest effect as long as this table is concerned.
| SPECIAL MORAE |
NOT SHORTENED |
SHORTENED |
%SHORTENED |
| Long vowel /H/ |
4,917 |
375 |
7.09% |
| Moraic nasal /N/ |
6,390 |
699 |
9.86% |
| Geminate /Q/ |
1,647 |
46 |
2.72% |
| No special mora |
40,780 |
428 |
1.04% |
|
The next table compares the shortening rates between APS and SPS. As expected, shortening rate is higher in SPS where speaking style was expected to be lower than APS. At the same time, however, shortening rate is not negligible in APS. This is contrary to the belief of some linguists who believe that the shortening is the unique characteristic of informal speaking style.
| SPEECH TYPE |
NOT SHORTENED |
SHORTENED |
%SHORTENED |
| APS |
36,311 |
907 |
2.44% |
| SPS |
10,030 |
637 |
5.97% |
|
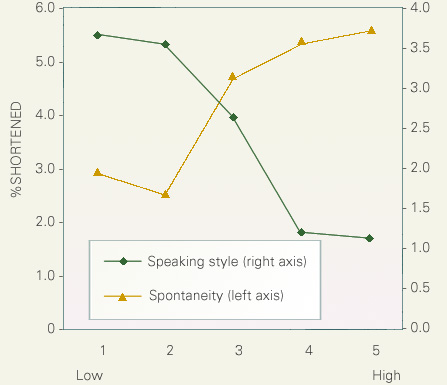
The following figure shows the correlations between the shortening rate on the one hand, and, the impressionistic ratings of speaking style and speech spontaneity on the other. The abscissa of the figure stands for the judged speaking style and spontaneity, and the ordinate stands for shortening rate. Shortening rate decreased monotonically as a function of the increase in judged speaking style, and, increased as a function of the increase in judged spontaneity.
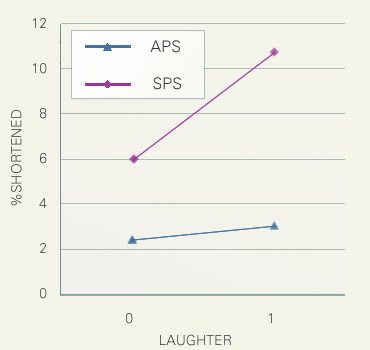
The following figure shows the effect of the extra-linguistic factor, 'laughter'. Here, the data is classified according to whether the utterance containing the long vowel in question involves the tag '(Laugh)' or not. This figure shows that presence of 'laughter' enhances the shortening rate strongly in SPS, but not in APS.
Lastly, this figure shows the interaction between the speaker's sex and speech type. In APS there was no statistically significant difference between males and female, but in SPS females' shortening rate was more than tripled compared to that of APS.
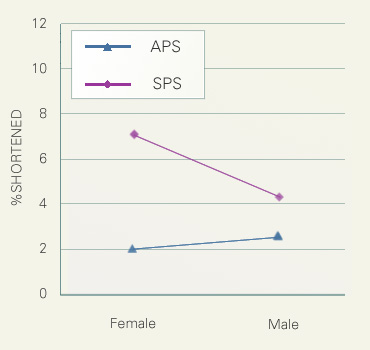
These two figures suggest that the shortening is enhanced in relaxed circumstances (as indicated by the presence of laughter), and, females change their speech more drastically to accommodate the change in circumstances than males.
|
| 6-5. Word coalescence |
|
Word coalescence is a morphological process by which (more than) two words are fused into one word. Here, we examine the case where /de/ and /wa/ are fused into /zya/. There are two types of /de/+/wa/ sequences differing in the POS of /de/ (/wa/ is always a topic particle) : a case particle of 'place' (e.g. Tokyo-de-wa ame-ga futta "It rained in Tokyo"), and, a rentaikei of an auxiliary verb (or copula) /da/ (e.g. ame-ga futta-no-wa Tokyo-de-wa nai "It was not Tokyo that it rained"). Both of these sequences can be coalesced into /zya/ (Tokyo-zya ame-ga futta, and, ame-ga futta-no-wa Tokyo-zya nai), but the probability of coalescence differs considerably depending on the POS of /de/. The following table shows the coalescence rate as a function of POS of /de/ and speech type. Coalescence rate is much higher in auxiliary verbs and in SPS.
| POS OF /de/ |
SPEECH TYPE |
N. /de wa/ |
N. /zya/ |
%COALESCED |
| Case particle |
APS |
1,311 |
11 |
0.8% |
| SPS |
389 |
19 |
4.7% |
| Auxiliary verb |
APS |
653 |
256 |
28.2% |
| SPS |
327 |
471 |
59.0% |
|
The following table examines the effects of the extra-linguistic factor, 'laughter'. Here, the data is classified according to whether the sequence of /de/+/wa/ occurred in an utterance containing the tag '(Laugh)' or not. The co-occurrence with '(Laugh)' enhanced considerably the coalescence. The same enhancing effect of '(Laughter)' was observed in the shortening of lexical long vowels. From these and other analyses, it turns out that 'laughter' is an important extra-linguistic factor of language variations.
| POS OF /de/ |
LAUGHTER |
N. /de wa/ |
N. /zya/ |
%COALESCED |
| Case particle |
Without |
1,686 |
28 |
1.6% |
| With |
14 |
2 |
12.5% |
| Auxiliary verb |
Without |
956 |
678 |
41.5% |
| With |
24 |
49 |
67.1% |
|
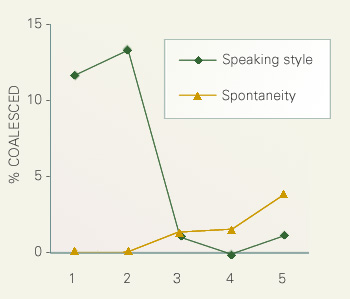
The following figure shows the correlations between the rate of coalescence and the two types of impressionistic rating: spontaneity and speaking style. Coalescence correlated positively and negatively with spontaneity and speaking style respectively, as was the shortening rate of lexical long vowels.
|
| 6-6. Boundary pitch movements |
|
Intonation labeling of the Core is currently underway, and expected to be finished by the end of May 2003. Here, distributions of two different boundary pitch movements (BPM) are compared. BPM is a characteristic change of pitch that marks the end of a prosodic unit, usually intonational, or intermediate, phrase. Intonation of spontaneous speech is characterized both by the richness of BPM inventory and the higher rate of BPM occurrence. The current X-JToBI inventory includes: L%H% (rising), L%LH% (sustained low followed by a rise), L%HL% (rising-falling), and, L%HLH% (rising-falling-rising).
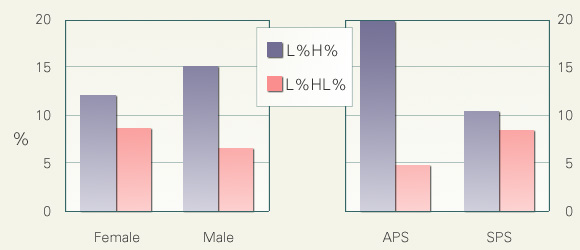
The following figures compare the occurrence rates of the two most frequent BPM: L%H% and L%HL%. The numbers in the figures are the number of occurrence of a given BPM divided by the total number of break indices (BI) stronger than 2. Note in the X-JToBI, there are BI like '2+b', '2+p', and '2+bp' whose strengths are supposed to be intermediate between canonical 2 and 3.
In this figure, distributions of the two BPM are shown as a function of speaker's sex and speech type. It is interesting to see that the two BPM behaved in nearly the opposite way with respect to both of these factors. Males used more L%H% than females, and, females used more L%HL% than males, and, APS had more L%H% than SPS, and, SPS had more L%HL% than APS.
These differences could be the consequence of style difference associated with these BPM. The next figure shows the correlations between the occurrence rates of these BPM and impressionistic ratings of speaking rate and spontaneity. Here again, the behaviors of the two BPM are in opposite directions. The rate of L%H% was correlated positively and negatively with the perceived speaking style and spontaneity, respectively, while the rate of L%HL% was correlated negatively and positively with the perceived speaking style and spontaneity respectively.
|
| 6-7. Factors of variation |
|
So far, we have seen that CSJ could be an excellent resource for the study of language variations. The following table is the summary of one-way ANOVA applied for the combinations of various linguistic variables and extra-linguistic factors. (Note NO1 and NO2 are not explained in the current web pages. It will soon be done.)
| VARIABLES |
N |
FACTORS |
| Type |
Spk rate |
Style |
Spnt |
Laugh |
Sex |
| Vowel devoicing |
300,018 |
**** |
**** |
**** |
**** |
NS |
**** |
| Shortening of long vowels |
47,886 |
**** |
NS |
**** |
**** |
**** |
**** |
| Coalescence: ZYA1 (particle) |
1,730 |
**** |
NS |
**** |
*** |
*** |
NS |
| Coalescence: ZYA2 (aux. verb) |
1,707 |
**** |
NS |
**** |
**** |
**** |
NS |
| NO1 (case) |
32,317 |
** |
NS |
**** |
** |
NS |
**** |
| NO2 (nominal) |
16,900 |
**** |
**** |
**** |
**** |
**** |
**** |
|
Significant at **** P<. 0001, *** P<. 001, ** P<. 01, NS P>=. 01
Among the factors analyzed, 'Type' denotes the difference between APS and SPS, 'Spk rate' denotes within-speaker normalized speaking rate, 'Style' and 'Spont' denote impressionistic ratings of speaking style and spontaneity respectively, 'Laugh' denotes presence vs. absence of '(Laug)' tag in an utterance, and, 'Sex' denotes speaker's sex. At least four of these factors had significant effect on the observed language variations.
|
| 6-8. PCA of POS difference |
|
From the early stage of POS analysis of CSJ, it was estimated that there was a systematic difference of POS distribution between APS and SPS. Relatively speaking, APS is marked by higher rate of nouns and case particle, while SPS is marked by higher rate of adjectives, adverbs, and conjunctions. The following figure shows the result of the principal component analysis of POS difference. The first two principal components (PC1 and PC2) represent respectively about 55 and 20% of the variance contained in the data. Data clouds of 141 APS and 281 SPS were separated clearly on the PC1-PC2 plane.
|
|
|