 |
 |
|
The full-fledged evaluation of the CSJ has not been conducted, but here are results of some preliminary investigations showing hitherto unknown characteristics of spontaneous speech.
|
| 6-1. Speaking rate |
 |
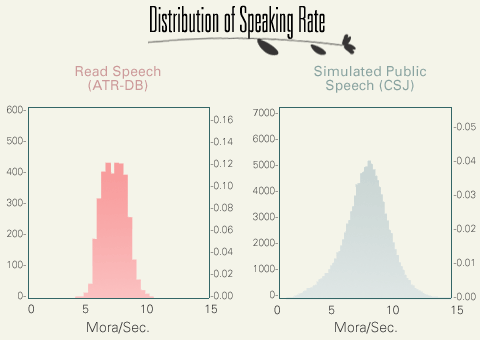
This figure compares the speaking rates (number of morae per sec) of the CSJ and ATR read-speech database. In addition to the higher average speaking rate (8.01 as opposed to 7.11 of ATR), CSJ is characterized by its greater standard deviation (2.07 as opposed to 0.96 of ATR).
The following figure compares the speaking rates of the ATR read-speech, and SPS and APS of CSJ. SPS is faster than read-speech (ATR), but APS is even faster. It is interesting to see that APS of engineering societies are faster than that of humanities. This fact may be due to the difference of time allotted to the talkers. Generally speaking, the presentation time in the humanity is longer than that of engineering.
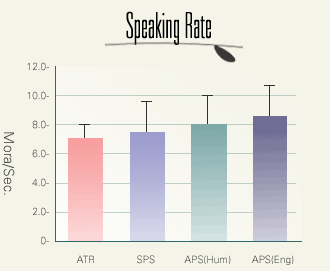
- CSJ speech is faster than read speech(ATR-DB).
- It also shows greater standard deviation.
- APS is faster than SPS.
- Engineering talk is faster than humanity talk.
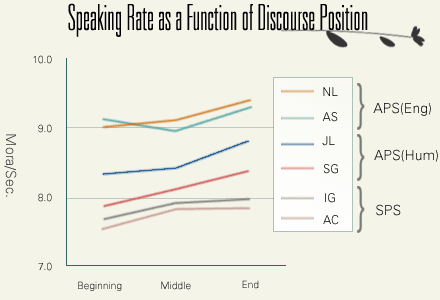
Mean speaking rate is computed from 30 transcription units at the beginning, middle, and end of speech files.
Lastly, this figure compares speaking rates at the beginning, middle, and end of a speech. In APS, speaking rate increases from the beginning to the middle, and increases again from the middle to the end. In SPS, on the other hand, the rise toward the end is not observed. This is most probably because we did not control the time of SPS as rigorously as in APS. We asked the SPS speakers to prepare talks no longer than 15 minutes, but we did not stop them even if they spoke longer than 15 minutes.
|
| 6-2. Disfluency |
 |
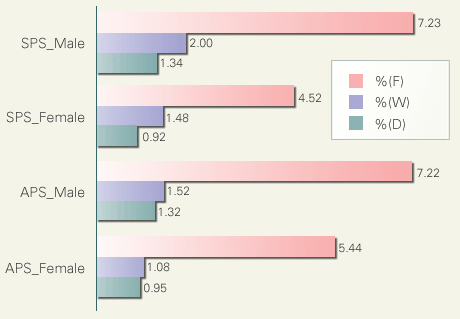
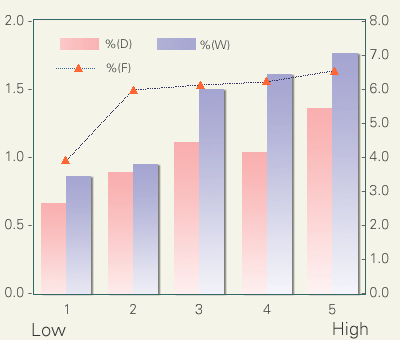
Disfluency is the most salient feature of spontaneous speech. Among the tags used in the transcription of CSJ, three tags are primarily concerned with disfluency. Tag '(D)' marks word fragments (more exactly, fragments of SUW), tag '(W)' marks reduced or incorrect pronunciation, and, tag '(F)' marks filled-pauses.
This figure shows the ratio of these tags to the total number of SUW as a function of speech type (APS vs. SPS) and speakers' sex. Males had more disfluency than females regardless of the speech type. At the same time, SPS contained more disfluency than APS with regard to (D) and (W). It is interesting to see that (F), the most frequent disfluency, behaved differently from (D) and (W). APS contained more filled-pauses than SPS. Since APS is supposed to be relatively less spontaneous than SPS, this casts doubt on the belief that filled-pauses are good indicators of speech spontaneity.
This figure examines how the ratios of (D), (W), and (F) are correlated with the impressionistic rating of spontaneity. Although all (D), (W), and (F) correlate positively with judged spontaneity (1 and 5 being the least and most spontaneous), correlation of (F) is less linear than those of (D) and (W). As for (F, significant difference exists only between 1 and 2. This figure suggests that (F) is a good indicator of the dichotomy between the read and spontaneous speech, but is not a good indicator of the degree of spontaneity.
|
| 6-3. Vowel devoicing |
 |
In Japanese, close vowels, /i/ and /u/, tend to be devoiced when they are both preceded and followed by voiceless consonants. This tendency is especially clear in Tokyo Japanese, which is the body of Standard Japanese. Some phonemic analyses, accordingly, describe devoiced vowels as the conditional variants of voiced vowels. However, this is too much a simplification. Devoicing rate of close vowels varies depending on contexts.
The following table shows the effect of the manner of adjacent consonants. This is based upon the analysis of 427,973 segment-labeled vowels in the Core (as of August 2002). Numbers in each cell show the devoicing rate [%].
| VOWEL |
PRECEDING CONSONANT |
FOLLOWING CONSONANT |
| Affricate |
Fricative |
Stop |
| /i/ |
Affricate |
81.1 |
33.3 |
89.4 |
| Fricative |
96.3 |
38.1 |
98.4 |
| Stop |
80.2 |
51.5 |
89.3 |
| /u/ |
Affricate |
77.2 |
48.1 |
94.5 |
| Fricative |
95.1 |
61.2 |
97.5 |
| Stop |
80.8 |
74.0 |
80.1 |
|
A following fricative significantly lowers devoicing rate. This is presumably because vowel devoicing in this context results in a succession of two frication noises whose boundary is very difficult to perceive.
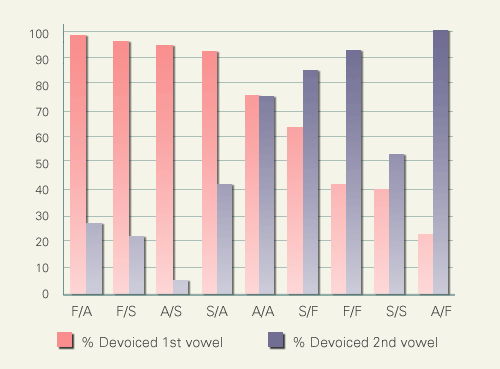
Another devoicing-preventing factor is the context of consecutive devoicing: contexts where more than two successive close vowels are all preceded and followed by voiceless consonants. The following figure examines the cases where two close vowels are in the context of consecutive devoicing. The abscissa of the figure is the combination of the consonant manner of the first and second morae containing close vowels. 'F', 'A', and 'S' stand respectively for fricative, affricate, and stop.
Here again, combination of consonant manner plays a crucial role. Devoicing rate of the vowels in the first mora remains high as long as the consonants of the second mora begin with a burst sound (i.e. either stop or affricate), while the rate is low in cases where the consonants of the second mora begin with a frication noise (i.e. fricative).
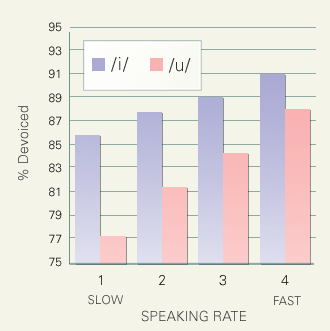
The next figure shows the influence of speaking rate upon close vowel devoicing. The abscissa in this figure stands for speaking rate normalized within a speaker. Speaking rate [mora/sec] is computed for all pause-separated utterances, and the slowest and fastest 25% are classified as 1 and 4 respectively. Devoicing rate is correlated positively with the speaking rate.
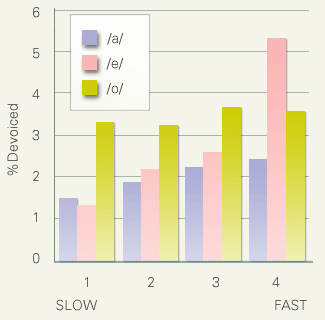
Lastly, this figure shows that devoicing of non-close vowels (i.e., /e/, /o/, and /a/) is also influenced by speaking rate.
|
|
|
|
|

